Looking at Reading Patterns Over Time: Are Some Classifications for Identifying Reading Disability Better Than Others?
By: Connie Barroso
The classification of a reading disability has been the battle at the front and center of current reading research. Although many researchers and educators have found ways to identify children with reading problems, the current issue at war here is the lack of consensus among the many different ways to identify reading disabilities. Changes in government policy have been made to make things easier for multiple classification schemes. The previously federally mandated aptitude-by-achievement standard, which used the difference between student IQ and achievement scores as a way to classify for reading disability, was been replaced by the Individuals with Disabilities Education Act (IDEA). This act lets individual states dictate their own standards for identifying reading disabilities.
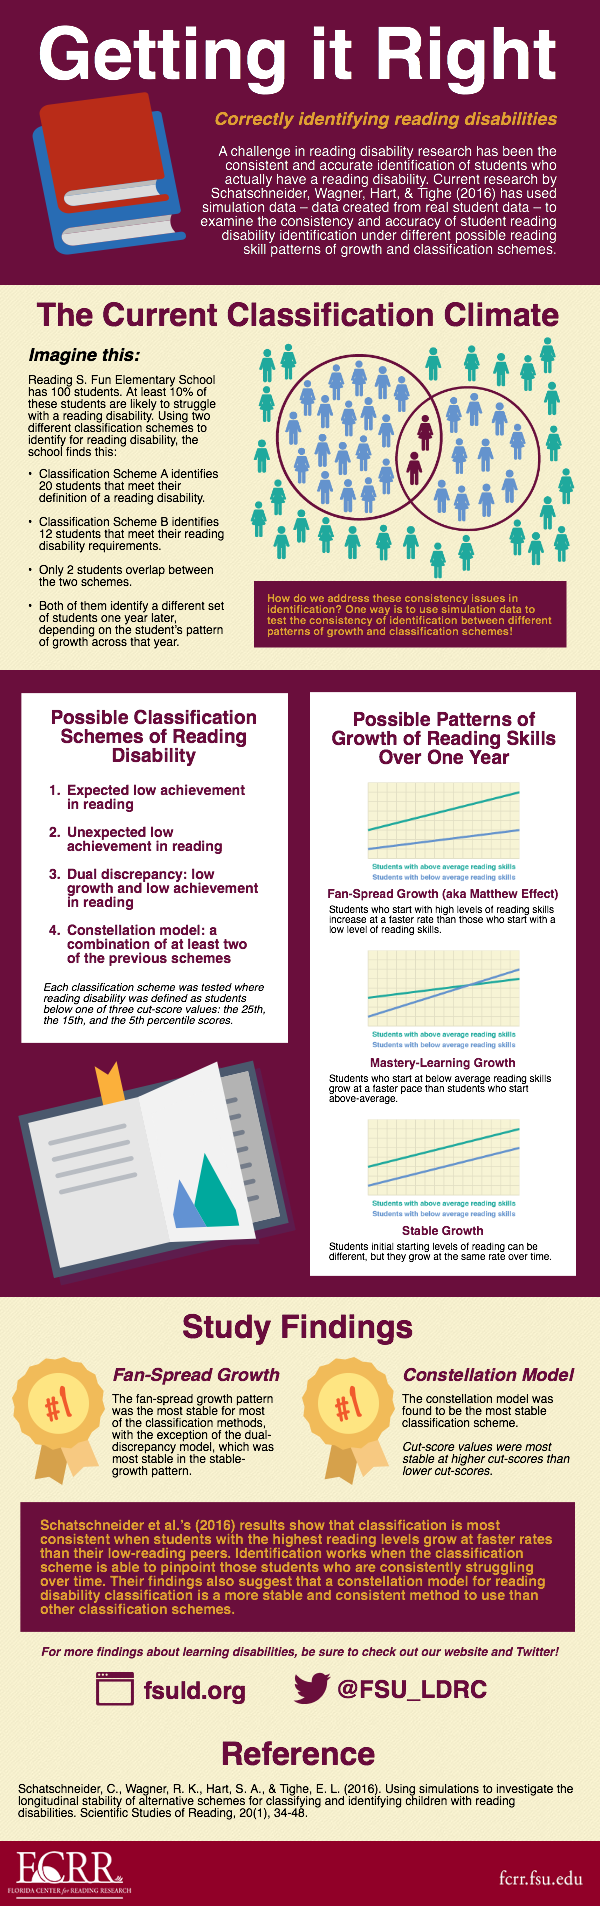
Allowing states to make their own decisions for classifying reading disabilities may sound like the next best thing compared to ineffectively identifying students with only one standard; however, this isn’t exactly the case. Research has found that beyond any cognitive or developmental issues, around 10% of the world’s population is likely to be affected with reading problems. So imagine this scenario: at Reading S. Fun Elementary School, there are 100 students. According to the previous statistic, around 10 students will likely have issues learning to read out of this group of 100 students. How do we figure out which students are the ones that need help?
Here is where the problem lies. Under classification scheme A, 20 students would meet the diagnosis of a reading disability. However, classification scheme B would diagnose only 12 children. From the students found to have a reading disability under both classification schemes A and B, only 2 children overlap. What’s worse is that a year later, both A and B are identifying different kids with a reading disability than from the previous year.
So why does this happen? Is it due to the differences in how reading is measured by the reading tests? What if the students are actually regressing back to average reading levels regardless of their true reading skill, as a result of repeatedly taking similar reading tests? Or is it that students are truly changing categories, from reading disabled to average reader and vice-versa? Either way, low agreement and unstable classifications over time raises red flags to developmental scientists in the reading disability field.
Prompted by these concerns, a study done by Schatschneider, Wagner, Hart, & Tighe (2016) used data simulations to examine these issues surrounding several of the current classifications for reading disability. Simulating data is a useful technique when manipulating things that can’t be manipulated- things like natural learning patterns in children, for example. One can intervene and provide varying lesson plans, but, naturally, children’s learning will be changing. “Forcing” students to not grow as fast as other students, or to grow at the same speed, is both inorganic and unethical. This is where simulated data comes in handy: by using an existing data set from 31,339 first and second grade students in Florida schools as a base, Schatschneider and his colleagues were able to create new data sets that resembled realistic possible reading growth patterns in children and manipulate those to test different classification schemes with specific types of growth.
In their study, they created three simulated data sets and manipulated them to represent three student growth patterns: a fan-spread pattern, where students with the highest starting points increase the most over time, while the students with the lowest starting point increase the least over time; a mastery-learning pattern, where students who start below average grow at a faster pace than above-average students; and a stable-growth pattern, where students all have the same growth no matter where they are on initial reading levels. They used 6 commonly used classification schemes to classify students as reading disabled in each pattern of growth. These classification schemes were (1) low achievement on end-of-year oral reading fluency (ORF) tests, (2) low achievement on end-of-year non-word reading fluency (NWF) tests, (3) unexpected low achievement on ORF as predicted by scores on a verbal aptitude measure, (4) same as previous but with unexpected low NWF achievement, (5) dual discrepancy classification, which means that students initial scores and scores over time on the ORF are similarly low, and (6) a constellation model, which is a combination of two or more of the previous 5 classifications as a diagnosis of reading disability. Additionally for each classification scheme, three cut-score values were tested at the 25th, 15th, and 5th percentiles for reading scores.
The researchers used these six classification schemes and three patterns of growth to investigate several questions: first, they wanted to find the pattern of growth that produced the most stable classifications of reading disability over time; second, they asked which cut-score values in each classification system produced the most stable results; and third, they wanted to know which classification scheme produced the most stable classifications of reading disability.
Results found that the stability of reading disability identification over time was highest in the fan-spread growth pattern. This means that for the classification schemes, the best growth pattern for students to be classified in was when students with higher reading levels increased at faster rates than students with low reading levels (consistency range from 44%-74%). This was the case for all 5 classification schemes except for the dual-discrepancy classification, which was more stable over time with the stable-growth pattern (consistency = 84%). Regarding the cut points, they found that the higher cut-score values were more stable and consistent across classification schemes over time than the lower cut points. As for the most stable classification scheme, they found that the rudimentary form of the constellation model (i.e., comprising of two or more of the other 5 classification schemes) produced the most stable classifications (consistency range from 68%-70%).
What might this mean for the concerns of not successfully identifying and treating students with a reading disability? Although this study does not necessarily give one definitive answer for the best way to identify a reading disability, it does provide evidence on the current state of affairs when examining classification schemes. The current stability rates can be considered low, even for the most stable classifications. Even still, a hopeful silver lining does appear in the findings from the constellation model. Similar to medical practice where multiple measures such as family history, x-rays, and blood tests are taken into account for a diagnosis, these findings suggest that even in the educational system, a reading diagnosis that takes into account many different sources of component skill levels in reading may be the best option for helping struggling readers.
Schatschneider, C., Wagner, R. K., Hart, S. A., & Tighe, E. L. (2016).
Using simulations to investigate the longitudinal stability of alternative schemes for classifying and identifying children with reading disabilities. Scientific Studies of Reading, 20(1), 34-48.